
Improve Presentation Skills for Six Sigma Project Reviews
Nobody has ever approved a project phase because the numbers spoke for themselves. Numbers need a speaker who says what changed, how sure the team is and what the room must decide. This guide shows how to present a Six Sigma project at tollgate reviews, on an A3 or storyboard, with charts a non-statistician can read, and at the final report-out. It closes with what the IASSC Green Belt exam expects you to know.

Why do the numbers never speak for themselves in a project review?
The sentence "the data speaks for itself" feels modern and rigorous, and it is the quickest way to lose a sponsor. A chart is evidence for a claim. If you do not state the claim, each person in the room invents one, and they will not all invent the same one. The finance manager sees a cost, the process owner sees criticism of her team, and the sponsor sees a delay.
Most Six Sigma people have a strong analytical habit and a weak telling habit, because the training is full of tools and thin on talking. That is why a Green Belt can run a flawless hypothesis test and still leave a review with the phase unapproved. The test answered a question the team had. The audience had a different question.
Three facts about the audience explain most of what follows.
- They arrive with a decision to make. A tollgate or phase-gate review exists so that someone with authority can approve, redirect or stop the work. Your presentation is the paperwork for that decision, not a tour of your analysis.
- They have read very little. Even when you send a pre-read, assume most of the room scanned it in a lift. The deck has to work for someone who knows nothing about your process map.
- They are not statisticians. A sponsor should never have to decode a p-value, a Cpk or an axis label to find out whether the project is working.
So every slide has one job: to make one point that moves the decision forward. If a slide cannot be described in a single sentence that starts with a verb or a result, it is analysis that belongs in the appendix.
What should a tollgate review hold, and in what order?
A tollgate review closes one phase of a project and asks for permission to start the next. The phases of DMAIC (Define, Measure, Analyze, Improve, Control) each end at one. The mistake is to present everything you did in that phase, in the order you did it. Present the answer to the question the gate exists to settle.
| Gate | The question the sponsor is really asking | The slide that answers it |
|---|---|---|
| Define | Is this problem worth solving, and is the scope realistic? | The problem statement with its size in money, time or defects, beside the goal and the boundary |
| Measure | Can we trust the numbers we are about to analyse? | The baseline chart, with one line on how the measurement was checked |
| Analyze | Do you know what causes the problem, or only what correlates with it? | The verified causes ranked by their effect, with the evidence behind the top one |
| Improve | Does the fix work, and what does it cost to keep? | Before-and-after results from a pilot, with the cost and the owner of the change |
| Control | Will it still hold when you leave? | The control plan, the monitoring chart and the named person who watches it |
Build the deck around the gate question and keep it short. Five to eight main slides is usually enough; the rest goes into a clearly labelled appendix you can open when asked. A good running order is the same every time, so sponsors learn where to look.
- Where we are. One slide: the project goal from the charter, the phase just finished and the date.
- What we found. The result of the phase in one sentence, then the chart that proves it.
- How sure we are. What the data can and cannot say, in plain words.
- What it means. The effect on the goal, in the unit the sponsor already tracks.
- What we need. The decision requested, any risk, and the next phase plan with dates.
Send a one-page summary two working days ahead so that the meeting is spent on questions, not on reading. Open the review with the decision you want, not with the history. "By the end of this half hour we need your approval to pilot the new approval rule in two offices" focuses everyone, and it tells you early whether the room is with you.
Do an A3 report and a project storyboard do the same job?
They overlap but they are used in different rooms. An A3 report comes from Toyota's problem-solving practice and gets its name from the paper size, an A3 sheet of about 297 by 420 millimetres. The whole story sits on one sheet: the left side states the background, the current condition and the analysis, and the right side gives the target, the countermeasures, the plan and the follow-up. Because everything is visible at once, the reader can check whether the countermeasure actually follows from the cause.
An A3 is a conversation tool. It sits on a table between a Green Belt and a process owner, and they argue over it with a pen. It is not designed to be projected, and a crowded A3 shown on a screen is unreadable. Use it for working sessions, for coaching with your Black Belt and as a one-page record that travels with the project.
A storyboard is the formal-room version. Lay out every slide on a wall, or in a slide sorter view, and read only the titles from first to last. The titles should read as the story: a result in each, in the order a sceptic would ask for them. "Cycle Time Analysis" is a label. "Approvals take 6.1 days against a 4-day target" is a story beat. If the titles on their own do not give the sponsor the story in thirty seconds, no amount of polish on the slides underneath will rescue it.
The test is simple and worth doing before every review: hand the titles to a colleague who has never heard of the project and ask her to tell you what the project is, what you found and what you want. Where she stumbles, a title is vague or a slide is missing.
Which chart carries which message to people who are not statisticians?
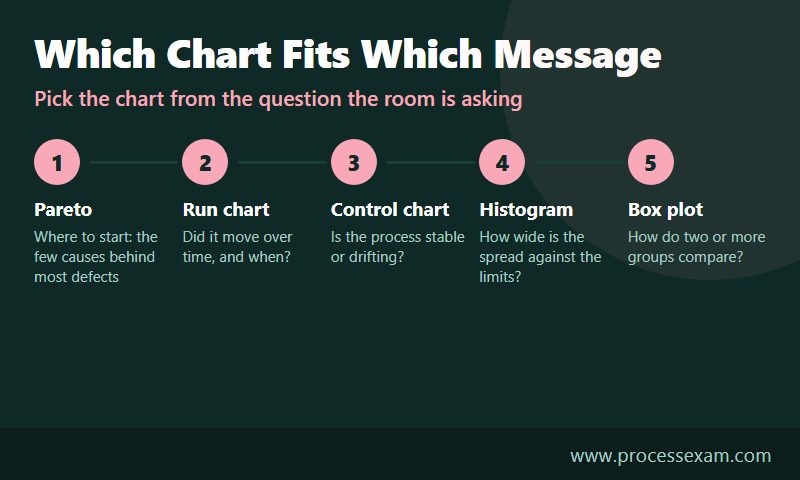
Choose the chart from the question the room is asking, not from the tool you used. The same data set can be drawn six ways, and only one or two of them will answer what this audience wants to know.
| What the room wants to know | Chart | What to put on it | The common trap |
|---|---|---|---|
| Where should we start? | Pareto chart | Causes ranked by count or cost, with the cumulative line, and the top two or three highlighted | Too many thin bars; group the small ones as "other" |
| Did it change, and when? | Run chart | Results in time order, a mark where the change went live, and the target as a line | Showing two averages and no timeline, which hides whether the gain held |
| Is it stable or drifting? | Control chart | The centre line and limits, with any signal circled and explained | Showing the limits without saying that they are not the customer's specification |
| How much of it is out of bounds? | Histogram | The spread of the results with the specification limits drawn as vertical lines | Choosing bins that make the shape look better or worse than it is |
| How do these groups differ? | Box plot | Each group side by side on a common scale, with the median marked | Showing the box plot to people who do not know how to read one, without a key line |
Three habits make these charts work in a room.
Put the message in the title, and the unit on the axis
"Run chart of approval time" tells the viewer what kind of chart it is. "Approval time fell from about six days to under four after week 9" tells them what to see. Label the axis with the unit the business uses, such as days, errors per thousand or pounds, and keep the scale honest. A truncated axis can make a small change look dramatic, and sponsors who notice will stop trusting the rest of the deck.
Translate statistics into a sentence about luck and size
A hypothesis test answers one question: could a gap this large appear by chance alone? A p-value of 0.003 means that if the change had no real effect, a gap this large would turn up about three times in a thousand. Nobody outside the Black Belt community needs that explanation on a slide. Write "the difference is very unlikely to be luck" and show its size in business units. The test tells the room that the change is real, and the size tells them whether it matters. Both belong on the slide, and the second matters more.
Turn capability into defects a person can count
A Cpk of 0.8 means little to most sponsors. "About 16 invoices in every 1,000 miss the payment window" means a lot. Use the capability index to do the work, then present the defect rate it implies, and reserve the index itself for the appendix or the Black Belt.
When in doubt about what a chart should say, practise reading charts the way the exam asks you to. The free ICGB sample questions include items on choosing and interpreting these tools, which is a useful rehearsal for explaining them aloud.
What does a weak slide look like beside a strong one?
This worked example is illustrative. The project and figures are invented to show the method and do not come from a real company.
The team has been working on invoice approvals in an accounts payable department. The charter goal was an average approval time of four days or less. The team changed the routing rule in week 9. Here is the slide they first drafted for the Improve gate.
Weak slide. Title: "Cycle Time Analysis." Body: a screenshot of statistical software output showing a two-sample t-test, with a p-value of 0.003, a confidence interval and eleven bullets on the method. A histogram in a font nobody can read sits in the corner.
Everything on that slide is true, and none of it helps the sponsor decide. The reader has to find the result, work out which group is "before", and guess whether 0.003 is good. The team knows what it means, so the slide looks complete to them.
Here is the same content, rebuilt by asking what one point the slide must make and what the room needs to see to believe it.
Strong slide. Title: "Invoice approval now takes 2.6 days less, and the gain has held for 12 weeks." A run chart of weekly average approval time, with a vertical line at week 9 and the 4-day target as a dashed line. Below it, one sentence: "Before the change the average was 6.1 days; since then it is 3.5 days. The difference is very unlikely to be luck." A right-hand box: "About 310 invoices a month are now paid inside the discount window. Decision needed: approve rollout to the other two offices."
Put the two versions in a table and the differences are easy to see.
| Element | Weak version | Strong version |
|---|---|---|
| Title | Names the analysis | States the result and how long it has held |
| Evidence | Software output | Run chart with the change and target marked |
| Statistics | The p-value, unexplained | One plain sentence about luck, plus the size of the gain |
| Business meaning | Left to the reader | Invoices paid on time each month |
| The ask | None | Approve rollout to two more offices |
| Method detail | Eleven bullets on the slide | Moved to the appendix, ready if asked |
Notice what was added and what was removed. The strong version has more business content, such as the target, the monthly effect and the ask, and far less method. The method was not dropped. It moved to a backup slide where it is available to the one person in the room who wants it.
How do you handle the questions a sponsor will ask?
A review is a conversation, and the questions are not an attack on you. They are the sponsor working out whether to put their name on the next step. Most questions fall into a small number of types, and you can prepare for all of them.
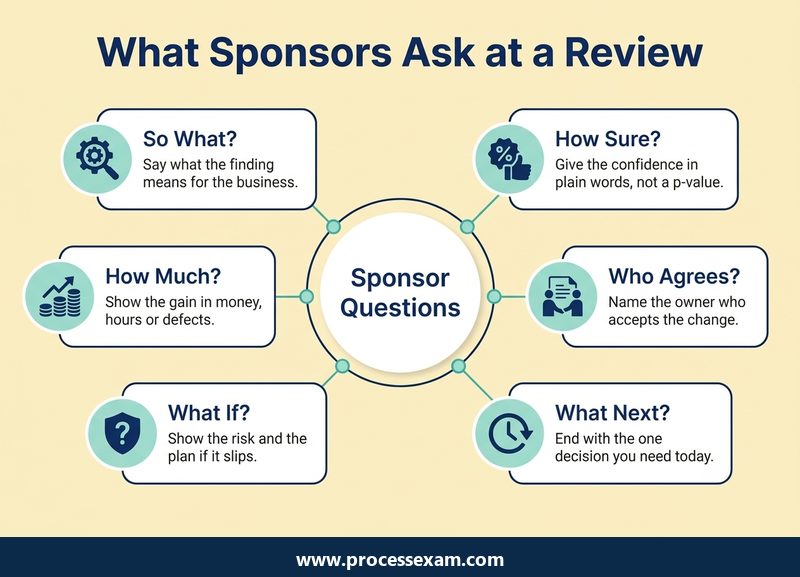
Before the meeting, write the six questions in the picture on a sheet and answer each in one sentence. Where you cannot, you have found a gap to close before the review rather than during it.
Answer first, then show the evidence
When someone asks "is this a one-off?", the first words out of your mouth should be "No, it has held for twelve weeks", followed by the chart. Answering with the chart and hoping the sponsor reaches your conclusion on their own wastes the room's time and makes you look unsure.
Say what you do not know, and when you will know it
"I don't have that figure. I will confirm it with finance and send it by Thursday" is a strong answer. A guess that you later correct is far more costly than a short delay. Write the question on a visible list of open items so everyone sees that it was heard.
Pre-wire the people who will push back
The sponsor's reaction should never be a surprise. A few days before the review, walk the process owner and any manager whose area changes through the key result, and listen. If the process owner learns in the meeting that the new rule will add a step for her team, the review will be about her objection and not about your result. Early conversations let you fix the genuine problems and turn the rest into support.
Keep a backup section
Prepare appendix slides for the questions you expect: the measurement check, the sample size, the data cleaning, the alternatives you ruled out. Label them clearly so you can jump to one in seconds. Needing a backup slide is a sign that your main deck was lean enough, and not a sign that you left something out.
How do you run the final project report-out?
The final report-out closes the project. The audience is wider than at a tollgate, often including senior leaders, finance, the process owner's whole team and people who never saw an earlier review. The purpose is to confirm the result, transfer ownership and record what the organisation learned.
A twenty-minute slot works well when you plan for about ten minutes of presenting and ten for discussion. The structure that holds up best follows the charter, since the charter is the promise the sponsor approved at the start.
- The promise. The problem statement and the goal exactly as chartered, with the original baseline.
- The result. The final figure against the goal on one chart, stated first and plainly, whether or not the goal was met.
- The money and the other benefits. A benefit figure that the finance partner has confirmed. State who signed it off, and keep non-financial benefits such as quality or customer effect separate.
- The cause and the fix, in one page. The root cause that was proven and the change that addressed it, told as a short story with one picture.
- The control plan and the owner. What is measured, how often, who watches and what they do when a signal appears. Name the process owner who accepts the hand-over.
- What we learned. What the team would do differently, plus any other process where the same cause could be at work.
Three habits separate a respected report-out from a forgettable one.
Lead with the result, including a disappointing one. If the project reached three days against a four-day goal, say it on the second slide. If it reached five, say that, and say what the evidence shows about why. A leader who discovers a missed target on slide fifteen will doubt everything before it. One who hears it up front tends to engage with what can be done next.
Rehearse once with a person who was not on the project. Time the talk, take the questions seriously and ask them to mark every term they did not understand. Replace those terms. Nobody outside the team knows what "SIPOC" or "Cpk" stand for, and nobody will say so during the presentation.
Share the platform. Let the process owner say how the new process works, and let a team member say what changed in the daily work. A hand-over spoken by the person who inherits the process is more credible than one narrated by the Green Belt. Credit the team by name, because the next project will need these people again.
Finish by asking for the formal close: confirmation that the result is accepted, the process owner holds the control plan and the sponsor agrees to close the project. Without that sentence, projects drift on in the register for months.
What does the IASSC Green Belt exam cover that helps with presenting?
The exam does not test slide design, and no candidate is asked to build a deck. What it tests is the knowledge that sits underneath a good presentation: which tool answers which question, what a chart or a test result means and how to read each one. That is the difference between a Green Belt who can explain a result and one who can only produce it. IASSC's Green Belt page describes the certification and gives the current requirements.
| Exam detail | ICGB |
|---|---|
| Full name | IASSC Certified Lean Six Sigma Green Belt |
| Exam code | ICGB |
| Vendor | IASSC |
| Number of questions | 100 |
| Duration | 180 minutes |
| Passing score | 70% |
| Exam fee | USD $350 |
The questions are multiple choice or true and false. That format rewards the habits in this article: know why a chart suits a question, say what a result means in words and recognise a misleading display. Spend your practice time explaining each tool in one plain sentence, since the sentence you would say to a sponsor is usually the one the correct answer option is paraphrasing.
To check where your reading of charts and results stands, the ICGB practice exam gives you the exam's multiple-choice style in a form you can work through at your own pace, and your wrong answers show you which tools you still describe loosely.
Frequently Asked Questions
How can I improve my presentation skills for Six Sigma?
Present the decision, not the analysis. Write each slide title as a result, put one chart on each slide, explain statistics in plain words and keep method detail in an appendix. Rehearse once with someone who was not on the project and replace every term they did not understand.
What should a Six Sigma tollgate review include?
A tollgate review should show where the project stands against its charter, the result of the phase just finished, how certain the team is, what it means for the goal and the decision needed. Add a short plan for the next phase. Keep five to eight main slides.
Which chart should I use to present Six Sigma data?
Choose by the question being asked. A Pareto chart shows where to start, a run chart shows change over time, a control chart shows stability, a histogram shows spread against specification limits and a box plot compares groups. Put the finding in the chart title.
What is an A3 report in Six Sigma?
An A3 report tells a project's story on a single sheet of A3 paper, about 297 by 420 millimetres. One side holds the background, current state and analysis, and the other holds the target, countermeasures, plan and follow-up. It suits working conversations better than a projected screen.
How do I present a p-value to non-statisticians?
Do not put the p-value in the headline. Say that the difference is very unlikely to be luck, then show its size in business units such as days saved or defects avoided. Keep the test details in the appendix for anyone who asks to see them.
- Lean Six Sigma |
- IASSC Lean Six Sigma Green Belt Sample Questions |
- ICGB Exam Questions Download |
- ICGB Test Questions |
- Lean Six Sigma Green Belt PDF |
- IASSC Lean Six Sigma Green Belt Book |
- IASSC ICGB BOK PDF |
- Lean Six Sigma Green Belt Certification Cost |
- Lean Six Sigma Green Belt Certification Requirements |
- IASSC Lean Six Sigma Green Belt Test Questions |
- ICGB Question Bank |
- ICGB Body of Knowledge (BOK)


