
Six Sigma Beyond the Factory: Six Departments Where It Pays Off
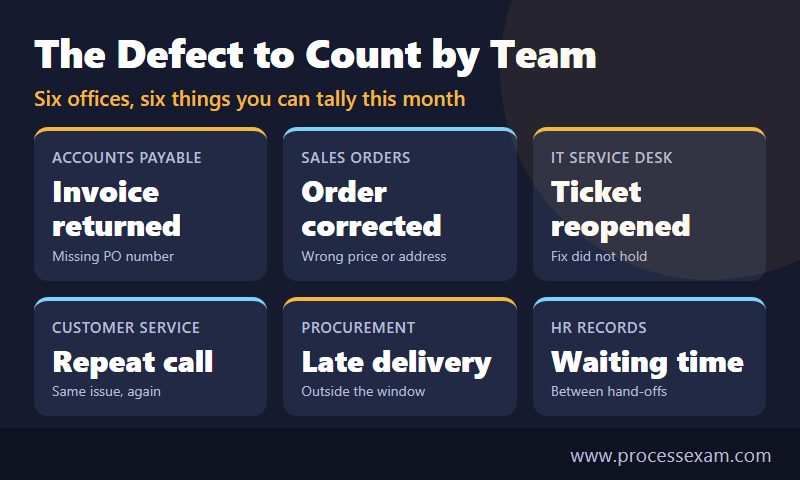
An accounts payable lead gets a Six Sigma course invitation from a colleague and deletes it: "We do not make anything, we pay bills." She is wrong, and so is anyone who thinks the method stops at the factory gate, because a late invoice, a mistyped order or a reopened ticket is a defect just as a cracked casting is. The six departments below, finance, sales operations, IT support, customer service, procurement and HR, each get the defect to count, the metric, a small worked example and the tool that fits.

Then that same lead looks at last month: one invoice in eight went back to the supplier or the buyer for a missing purchase order number, and each of those loops took days. Nobody called it a defect, yet it was one, it recurred, and it could be counted. That is the whole idea of this article: the method was born on production lines, but what it needs is a repeatable process and a way to count what goes wrong, and offices are full of both.
Does Six Sigma only belong on a factory floor?
No. What transfers from a plant to an office is not the machinery but three habits: define what the customer of the process needs, count how often the process misses it, and look for the cause in the data instead of in the nearest person. A customer can be an external buyer, or the next department down the line. A defect is anything that forces the customer to wait, chase, correct or repeat. Wikipedia's summary of Six Sigma traces the method back to manufacturing, which explains the reputation, but its tools are generic: they work on any process whose steps you can write down.
The cost of ignoring this is rarely visible in a budget line. Rework in an office hides inside normal salaries: the clerk who re-keys an order, the analyst who chases a missing approval, the agent who takes the same call twice. Because nobody invoices for it, nobody measures it, and so it never becomes a project. The six examples below pick processes where a small, honest count changes that.
All numbers in the worked examples are invented for illustration. They show the arithmetic and the reasoning, not results from any real company, so do not quote them as benchmarks.
| Department | Typical defect | Metric to track | Tool that fits |
|---|---|---|---|
| Accounts payable | Invoice returned or paid late | Invoices processed right first time | Pareto chart of return reasons |
| Sales order entry | Order corrected after entry | Orders needing a correction, per 100 | Cause-and-effect (fishbone) diagram |
| IT service desk | Ticket reopened | Share of tickets reopened within 7 days | Control chart |
| Customer service | Customer calls again about the same issue | Repeat contacts per resolved issue | Critical-to-quality tree |
| Procurement | Delivery outside the promised window | Spread of supplier lead time | Histogram and capability view |
| HR records | Change request waits between hand-offs | Waiting time against hands-on time | Process map with timings |
Can accounts payable have defects you can count?
It can, and it is usually the easiest office process to start with, because every invoice leaves a trail. A defect here is an invoice that cannot be paid as received: a missing purchase order number, a price that does not match the order, a wrong cost code, a duplicate submission. Each one sends the paper back along the chain, adds days, and, in the case of duplicates, risks paying twice.
The metric
Count invoices processed right first time, meaning no return, query or manual correction between receipt and payment. Divide by invoices received in the same period. It is an honest figure because it counts the customer's experience of the process, not the effort of the people inside it.
An illustrative worked example
Suppose a team samples 400 invoices in a month and 52 need rework. Right first time is 348 of 400, which is 87%. The team does not guess why; it tallies the reasons on a check sheet and sorts them from largest to smallest, which is what a Pareto chart does.
| Reason for rework | Invoices | Share of the 52 |
|---|---|---|
| Missing purchase order number | 21 | 40% |
| Price differs from the order | 14 | 27% |
| Wrong cost code | 9 | 17% |
| Duplicate submission | 5 | 10% |
| Other | 3 | 6% |
Two reasons account for more than two thirds of the rework. A team that spends its time on cost codes or duplicates is working on 27% of the problem. The sensible first move is upstream: stop invoices without a purchase order number at the mailbox, and tell suppliers once, clearly, what the number looks like. If that one change cuts the first cause from 21 to 3, total rework falls from 52 to 34 and right first time rises from 87% to 91.5%. Nothing about it needed new software.
Where it goes wrong
The common trap is to count only the invoices that were returned. Invoices fixed quietly by a clerk who rang the supplier never show up in a return log, so a sample that follows each invoice from receipt to payment gives the truer number. A second trap is aiming at speed alone: paying faster by skipping the three-way match produces a lower defect count on paper and a bigger loss in practice.
Why do sales orders get corrected after they are entered?
Because the order passes through several hands and several formats before it reaches the warehouse, and every hand-off is a chance to mistype or misread. A sales order defect is an order that needs a correction call, an amended confirmation or a credit note. The customer sees it as a company that cannot get a simple thing right.
The metric
Track orders needing a correction per 100 orders. For a finer view, list the fields on an order that can be wrong, such as customer, product code, quantity, price, delivery address and tax, and count wrong fields as well. Keep the unit simple at first so that the sales manager and the finance director read the number the same way.
An illustrative worked example
Say 1,000 orders were entered last month and 90 were corrected later, a rate of 9 per 100. The team sets up a fishbone diagram with the main bones for people, method, tools and inputs, then asks the order-entry staff, not their managers, for causes. Each reported correction is then tagged with one cause.
| Cause of correction | Orders | Fishbone branch |
|---|---|---|
| Customer's purchase order unclear or incomplete | 38 | Inputs |
| Price overridden by hand in a free-text box | 27 | Tools |
| Delivery address missing a field | 15 | Method |
| Everything else | 10 | Mixed |
The fishbone only organises hypotheses; the tally tests them. Here it points at two fixes that cost very little: a drop-down price list in place of the free-text box, and a rule that an order with an incomplete address cannot be saved. The 38 orders tied to unclear customer paperwork need a different kind of action, such as a standard order template sent to the ten customers who cause most of them. If those three fixes halve the corrections, the rate moves from 9 to roughly 4.5 per 100, and the sales team spends its calls on selling.
Where it goes wrong
Do not blame the person who keyed the order until the data says so. In an example like this one, a minority of the corrections trace to individual typing slips; most trace to a form that invites the error. A project that ends in a warning to staff has found the symptom, not the cause.
Is a reopened ticket on the IT service desk a defect?
It is the closest thing the desk has to a scrapped part. A ticket the agent marks as resolved and the user reopens within a week means the fix did not hold, or the agent closed it before confirming. Each reopened ticket costs a second round of effort and a user who trusts the desk a little less.
The metric
The share of tickets reopened within seven days of closure, tracked weekly. It is a proportion, so the right chart is a control chart for proportions, usually called a p-chart. A control chart is what separates a real change from the ordinary week-to-week wobble that every process has.
An illustrative worked example
Assume the desk closes about 400 tickets a week and the reopen rate over eight weeks reads 6%, 7%, 5%, 8%, 6%, 7%, 6% and 5%. The average is 6.25%. For a proportion with 400 cases a week, the usual control limits sit at the average plus and minus three standard errors. The standard error is the square root of 0.0625 times 0.9375 divided by 400, which is about 1.2 percentage points, so the limits fall near 2.6% and 9.9%.
| Week | Reopen rate | Reading |
|---|---|---|
| 1 to 8 | 5% to 8% | Inside the limits: normal variation, no cause to chase |
| 9 | 12% | Above the upper limit near 9.9%: something changed |
The value of the chart is in what it stops you doing. A manager who sees 8% in week four and panics wastes a meeting on noise. The same manager who sees 12% in week nine, after a new knowledge-base article went live, has a signal and a suspect. The next step is to read the reopened tickets from that week, which usually names the cause within an hour.
Where it goes wrong
Agents who are scored only on speed to close will close tickets early. A reopen metric next to the speed metric keeps the pair honest, and the control chart makes it hard for either number to be gamed without showing.
How does a call centre cut repeat calls without rushing agents?
By treating the repeat call as the defect and the first call as the product. Most call centres report average handle time because it is easy to capture, yet a short call that leaves the customer ringing again later is more expensive than a longer call that finishes the matter. The same logic applies to BPO teams working for clients, where the contract metric and the customer's real need can drift apart.
The metric
Repeat contacts per resolved issue: of the customers who called about a particular problem, how many had to call, chat or email again within seven days. It needs the contact log to be linked by customer and reason, which is often the first improvement the project delivers.
An illustrative worked example
Take two teams. Team A averages 5 minutes per call and 45% of its customers contact the centre again about the same problem. Team B averages 6 minutes and 10% do. In simplified terms, A uses 1.45 contacts per issue, so 5 x 1.45 gives 7.25 agent minutes per resolved issue. B uses 1.10, so 6 x 1.10 gives 6.6. The team with the longer calls is the cheaper one, and its customers are happier. This is a simplification, since some customers call more than twice, but the direction holds.
The tool: a critical-to-quality tree
A critical-to-quality (CTQ) tree turns a vague customer wish into something you can measure. It starts from what the customer says and branches down to a requirement with a number attached.
| What the customer says | The driver behind it | A measurable requirement |
|---|---|---|
| "I want to know where my order is" | Status is clear and current | Tracking updated within a stated time of dispatch |
| "I do not want to explain twice" | History follows the customer | Agent sees earlier contacts on the same issue |
| "Fix it on this call" | First-contact resolution | Share of issues closed without a second contact |
Where it goes wrong
The tree is built from customers' words, not from the agents' guesses, and that means someone must listen to calls or read survey comments before drawing it. A tree drawn in a meeting room mostly confirms what the room already believed.
Where does procurement lose time that no invoice shows?
In the variation between deliveries. A supplier whose average lead time looks fine can still wreck production planning if the spread is wide, because the buyer has to plan for the worst delivery, not the average one. Procurement's defect is a delivery, quote or approval that falls outside the window the business was promised, and the cost lands in other departments as expedited freight, idle staff or emergency buys at a worse price.
The metric
Spread of lead time against the requirement, alongside the familiar on-time-in-full rate. The first tells you why the second is low; the second tells you how often it hurts.
An illustrative worked example
The business needs goods within 10 days of an order. Ten recent deliveries from each of two suppliers, in days:
| Supplier | Lead time of ten deliveries, in days | Average | Deliveries over 10 days |
|---|---|---|---|
| Supplier X | 8, 8, 7, 9, 8, 8, 9, 7, 8, 8 | 8.0 | 0 |
| Supplier Y | 4, 5, 6, 15, 7, 5, 13, 6, 14, 5 | 8.0 | 3 |
The averages are identical, so a report of average lead time would score them the same. A histogram of the two sets tells the truth: X is tightly bunched between 7 and 9 days, Y is scattered from 4 to 15 and misses the window three times in ten. The capability question that follows, how much of the spread fits inside the requirement, is one a Green Belt candidate meets in the measure and analyse stages. In practice it moves the conversation with Y from "you are slow" to "your process is unstable; what changes between the 5-day and 15-day deliveries?"
Where it goes wrong
Ten data points are enough to spot an obvious problem but not enough to promise a number. Collect more before putting a figure into a supplier contract, and check whether the long deliveries cluster around a product, a warehouse or a time of year.
How long does a simple records change take in HR, and where does it wait?
Longer than anyone in the process would guess, and almost all of it is waiting. A change to an employee's bank details, address or name looks like a two-minute task. In many organisations it passes through the employee, an HR administrator, a manager, payroll and the HR system, with each hand-off adding a queue. HR already has a full article on Six Sigma for people processes; this example is deliberately a narrow one that sits between HR and payroll.
The metric
Elapsed time from request to confirmed change, compared with the hands-on time spent by everyone along the way. The gap between the two is the part of the process that adds nothing the employee can see.
An illustrative worked example
A process map with timings, built by walking five recent requests through the chain, might read like this:
| Step | Hands-on time | Waiting before the step |
|---|---|---|
| Employee submits the form | 10 minutes | None |
| HR administrator checks it | 15 minutes | 1.0 working day |
| Manager approves | 2 minutes | 1.5 working days |
| Payroll updates its records | 10 minutes | 0.5 working day |
| HR system confirms to the employee | 5 minutes | 0.5 working day |
Total hands-on time is 42 minutes. Total waiting is 3.5 working days. The manager's approval takes two minutes of work and a day and a half of waiting, so the obvious question is whether a change of bank details needs a manager at all, or only a check by a second person in HR. A tool as plain as a SIPOC overview followed by a timed map is enough to expose that, and the fix, a rule rather than a system, costs nothing.
Where it goes wrong
Controls exist for a reason: bank-detail changes are a known route for fraud, and removing an approval can make a process faster and weaker. The project's output is a decision about which control is proportionate, taken with finance and security in the room, and not a quiet deletion of a step.
How do you pick a first project, and where does the CSSGB come in?
Choose a process that repeats often enough to give you a count within a few weeks, that someone owns, and where the pain is already being felt. Avoid anything that depends on a system replacement or a reorganisation: a first project that waits on those will stall. A good test is whether you can write the defect in one sentence and count it without asking anyone's permission.
Before collecting anything, write a short project statement with four parts: the process, the defect, today's measured level and the level you aim for by a date. If you cannot fill the third part, your first task is measurement, not improvement. Many first projects in offices end up spending half their time building a trustworthy count, and that is a result in itself.
A belt is not a licence to start. Any team can run a project like these six with a process map, a tally sheet and a basic chart. What a credential adds is a shared vocabulary and a check that you can choose the right tool and read it correctly. The ASQ Certified Six Sigma Green Belt (CSSGB) is the credential aimed at people who lead or support projects of this size. ASQ lists the exam, its fees and its body of knowledge on its Green Belt certification page, which also describes the exam as open-book, so check there for the rules on what you may bring.
| CSSGB detail | Figure |
|---|---|
| Certification | ASQ Certified Six Sigma Green Belt (CSSGB) |
| Questions | 110 |
| Exam time | 258 minutes (total appointment time 270 minutes) |
| Passing score | 550/750 |
| Fee | ASQ members $383, non-members $483, retakes $283 |
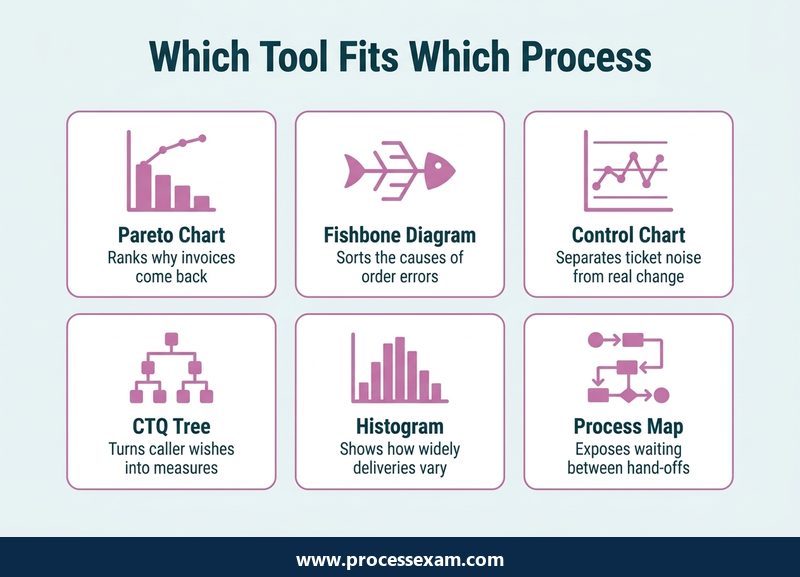
Each of the six examples above uses a tool that sits inside that body of knowledge: a Pareto chart, a fishbone diagram, a control chart, a critical-to-quality tree, a histogram and a process map. Once you can build and read them on your own process, a bank of exam-style questions on the same tools, such as the CSSGB practice exam, tests whether you apply them as the exam expects, and a few CSSGB sample questions are a quick way to see the style first.
Whichever process you start with, record the before figure now. A project that cannot show a starting count has nothing to compare against, however well it runs, and the count you keep is what turns the next sceptical colleague's "we do not make anything" into a question about their own invoices, orders or tickets.
Frequently Asked Questions
Is Six Sigma used outside manufacturing?
Yes. The method needs a repeatable process and a way to count what goes wrong, not a factory. Finance, sales operations, IT support, customer service, procurement and HR all run repeatable processes with countable defects such as returned invoices, corrected orders, reopened tickets and repeat calls.
Which department should try Six Sigma first?
Pick the process that repeats most often, has a clear owner and already causes visible pain. Accounts payable and the IT service desk are common starting points because every invoice and ticket leaves a record, so a baseline count is available within weeks without new software.
Does Six Sigma work in a call centre or BPO?
It does. The usual defect is the repeat contact, and the useful metric is repeat contacts per resolved issue rather than handle time alone. A critical-to-quality tree built from customers' own words ties the contract measure to what callers need.
Do I need a belt to run a Six Sigma project in my department?
No belt is required to map a process, tally defects and draw a Pareto or control chart. A certification such as the ASQ Green Belt adds a common vocabulary and proof that you can choose and read the right tool, which helps on larger projects with several teams.
How much does the ASQ Green Belt exam cost?
ASQ lists the CSSGB exam fee as $483 for non-members and $383 for ASQ members, with retakes at $283. The exam has 110 questions, and ASQ's page describes it as open-book. Check ASQ's certification page for current fees before booking.
- Six Sigma |
- ASQ Six Sigma Green Belt Sample Questions |
- ASQ Six Sigma Green Belt Test Questions |
- CSSGB Question Bank |
- CSSGB Exam Questions Download |
- CSSGB Test Questions |
- Six Sigma Green Belt PDF |
- ASQ Six Sigma Green Belt Book |
- ASQ CSSGB BOK PDF |
- Six Sigma Green Belt Certification Cost |
- Six Sigma Green Belt Certification Requirements |
- CSSGB Body of Knowledge (BOK) |
- CSSGB Handbook


