
Measuring Employee Satisfaction With Six Sigma: Metrics and a Worked Example
A satisfaction survey can report 74% favourable this year against 71% last year while the night shift still learns its rota on Friday evening and half the crew still hunts for a working scanner. The number moved; the work did not. Six Sigma closes that gap by treating satisfaction as something to define, measure and trace to causes, not as a mood to be managed.

This guide follows that logic for a team lead, HR partner or Yellow Belt who has been told to "improve engagement" with no further instruction. It covers how to turn the goal into measurable requirements, how to build a survey that can be trusted, which workforce metrics help and where they mislead, how to find the groups and drivers behind a low score, and how to tell a real change from noise. A worked example, with invented numbers and labelled as such, runs through one driver from first complaint to control plan.
Why can an engagement score rise while nothing changes on the floor?
Because a single annual score averages away almost everything a manager could act on. It mixes teams that are thriving with teams that are not, it arrives months after the events that shaped it, and it says how people feel without saying which part of the job caused the feeling. A better score can come from a different mix of respondents, a rewritten question or a pleasant month, none of which is an improvement.
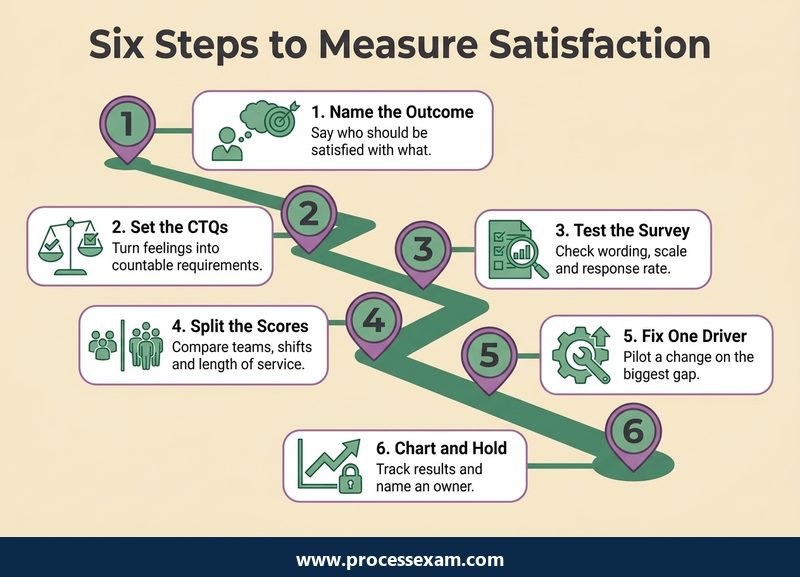
The original version of this article described a project of exactly this kind. An organisation judged satisfaction each year with Gallup's Q12 questionnaire, and outside consultants reported only the questions where results fell below the benchmark. Management wanted something more: why employees rated those particular items low. That is the point at which a Six Sigma approach becomes useful, because it asks for the cause, not the ranking.
Three habits separate a Six Sigma treatment from an ordinary survey exercise.
- Define before you ask. Decide what "satisfied" must mean in observable terms before any question is written.
- Trust the measurement before you trust the result. A survey is a measuring instrument and can be biased, unstable or too coarse, just like a gauge.
- Trace the score to a process. A low score on "I know what is expected of me" points to rota notice, briefings or job instructions that can be mapped and counted.
How do you turn "employee satisfaction" into something you can measure?
Start from the customer, who in this case is the employee, and work down the way a critical-to-quality (CTQ) tree works. The vague wish sits at the top. Each branch below it is a need the employee would recognise, and each leaf is a characteristic with an operational definition: a sentence precise enough that two people counting would get the same answer.
| Vague wish | Employee need | CTQ characteristic | Operational definition (example) |
|---|---|---|---|
| People should feel valued | Useful feedback on my work | Feedback is given and is timely | Share of staff who had a one-to-one in the last 30 days, taken from the diary, not from memory |
| People should feel in control | Predictable working time | Rota is known in advance | Rotas published at least 7 days before the first shift, counted per week |
| People should have what they need | Working tools and clear instructions | Equipment available at shift start | Stations with every listed item working at the start-of-shift check |
| People should want to stay | A reason to remain in this job | Staff stay beyond the first year | Leavers with under 12 months' service divided by average headcount, per quarter |
Two points about the table. First, the middle two rows are process measures: they come from records, so nobody's opinion is involved, and they change when the process changes. The first and last rows mix a record with a perception. Second, none of these requires a survey to produce its first number. A good CTQ tree usually reveals that some of the data already exists in rota systems, maintenance logs and HR records.
Write the operational definition before the question
"Feedback is timely" means nothing until it says whose feedback, over what period, recorded where, and who counts. Writing the definition first also exposes disagreements that would otherwise surface after the data is in. If the line manager and HR cannot agree whether a hallway chat counts as a one-to-one, a survey will not settle it; a definition will.
Choose the type of data deliberately
Survey answers on an agreement scale are ordered categories. A yes-or-no record such as "rota published on time" is discrete data and can be charted as a proportion. Days of notice is continuous. The type decides which chart and which test you may use later, so note it in the data collection plan next to each definition, together with the source, the person who collects it and how often.
Which survey design choices distort the number?
A survey is a measurement system, and the Six Sigma discipline of measurement system analysis applies by analogy. Industrial gauges are checked for bias, repeatability and reproducibility; the same worry applies to questions and respondents, even though the usual gauge R&R study cannot be run on opinions in exactly the same way.
Wording and scale
- One idea per question. "My manager is approachable and gives useful feedback" cannot be answered by someone who thinks the first half is true and the second false.
- Neutral phrasing. "How much do you enjoy our excellent training?" leads the respondent; "The training I received prepared me for my work" does not.
- A fixed scale. Keep the same number of points and the same labels year after year. Changing from five points to seven makes any comparison with the past meaningless.
- Report the distribution. Averages on an ordered scale hide a split workforce. A mean of 3.0 can mean everyone is neutral or half the staff are delighted and half are angry. Percent favourable (the top two answers) next to percent unfavourable tells the real story.
Who answers
Response rate is part of measurement quality, not a vanity figure. If 85% of the day shift replies and 30% of the night shift does, the overall score mostly describes the day shift. Non-response bias means the people who stay silent may differ systematically from those who answer: the most disengaged staff are often the least likely to open the survey. Non-response bias is a well-documented concept in survey research and is worth a quick read before the first analysis.
Record the reply count for every team beside every score. A score from six replies and a score from sixty should never share a chart without that information.
Trust and anonymity
People answer honestly when they believe the answer cannot be traced to them. If a team has only five members and the demographic questions identify the individual, truthful answers fall. Set a minimum group size below which results are not reported, and say so in the invitation. Explain too what will be done with the data; staff who saw no action after the last survey will answer the next one cautiously, if they answer at all.
Check the instrument itself
Two simple checks cost little. Ask a small pilot group to repeat a few questions a week later and compare the answers (a rough repeatability test); then ask two different people to explain what a question means to them (a rough reproducibility test). If the answers differ widely for reasons that have nothing to do with the work, rewrite the question before the full launch.
What can eNPS, turnover and absence tell you, and where do they mislead?
Survey scores describe feeling. Records describe behaviour. A balanced measurement plan uses at least one of each, because each corrects the other's weakness. Definitions matter more than any published average, so the table below gives the definitions and leaves out benchmarks, which vary by industry, country and the way the base is calculated.
| Metric | Definition | Type | Where it misleads |
|---|---|---|---|
| eNPS (employee net promoter score) | Ask "How likely are you to recommend this organisation as a place to work?" on a 0 to 10 scale. Promoters answer 9 or 10, detractors 0 to 6. Score = % promoters minus % detractors, from -100 to +100 | Survey | Moves sharply with small samples; hides why people answered as they did |
| Turnover rate | Leavers in a period divided by average headcount in the same period | Record, lagging | Mixes wanted and unwanted exits, retirements and fixed-term ends unless they are separated |
| Early attrition | Leavers within a set number of months of joining divided by starters in that cohort | Record, lagging | Points to hiring or onboarding, not necessarily to satisfaction of long-serving staff |
| Absence rate | Working days lost to absence divided by working days scheduled | Record, near-real-time | Sickness has many causes, so a rise needs a look at the pattern by team and weekday |
| Pulse item favourability | Share answering the top two options on a single, fixed question asked at short intervals | Survey, leading | Fatigue if asked too often; only valid when the question never changes |
The net promoter score method originated in customer research; its employee version borrows the same arithmetic, which is why the definition above is a convention and not a law. Whatever you choose, write the exact calculation in the data collection plan, because "turnover" calculated three ways produces three numbers.
Leading and lagging indicators
Turnover tells you about a decision someone made months ago. Absence and pulse questions respond faster. A sensible set pairs one lagging record (turnover or early attrition), one near-real-time record (absence or on-time rota) and one short survey item. When all three move together, believe the story; when they disagree, you have a measurement question to investigate before you have an engagement question.
Do not reward the metric
Set a target for the absence rate and people may come to work ill or labelled differently on the record; set one on turnover and exits may be reclassified. Report these measures to improve processes, not to rank individual managers. That distinction is a condition of honest data.
How do you find where the dissatisfaction actually sits?
Stratify first, then rank. Split every score by the factors that could plausibly matter, such as team, shift, site, length of service and job grade, and look for the cut that shows the biggest gap. The overall number is rarely where the signal lives. Stratification only works if the group sizes are large enough to report; combine small groups or leave them out.
Once the gap is located, count the free-text comments by theme and draw a Pareto chart of the counts. The chart simply sorts causes from largest to smallest and adds a cumulative line, so the few themes behind most of the complaints stand out. In the invented example below, a warehouse coded 80 survey comments from three shifts.
| Comment theme (illustrative) | Comments | Share | Cumulative share |
|---|---|---|---|
| Rota notice and shift changes | 31 | 39% | 39% |
| Equipment not working at shift start | 18 | 23% | 61% |
| Feedback from supervisors | 12 | 15% | 76% |
| Pay and allowances | 9 | 11% | 88% |
| Car parking | 6 | 8% | 95% |
| Other | 4 | 5% | 100% |
These figures are invented to show the method. Shares are rounded to whole percentages, so adding the individual shares may differ from the cumulative column by a point. The reading is the useful part: two themes account for about three-fifths of the comments, and neither is about pay. Two cautions apply to any Pareto chart of comments. Counting depends on how the themes were coded, so have two people code a sample independently and compare. And frequency is not the same as seriousness; a rare theme such as harassment deserves action whatever its position on the chart.
When is a move in the score real rather than noise?
Every survey result is an estimate from the people who answered, and estimates wobble. A simple approximation for the margin of error on a percentage is 1.96 times the square root of p(1-p)/n, where p is the share answering favourably and n the number of replies. It assumes a random sample, and applying it to a whole team that answers is conservative, but it gives a sense of scale.
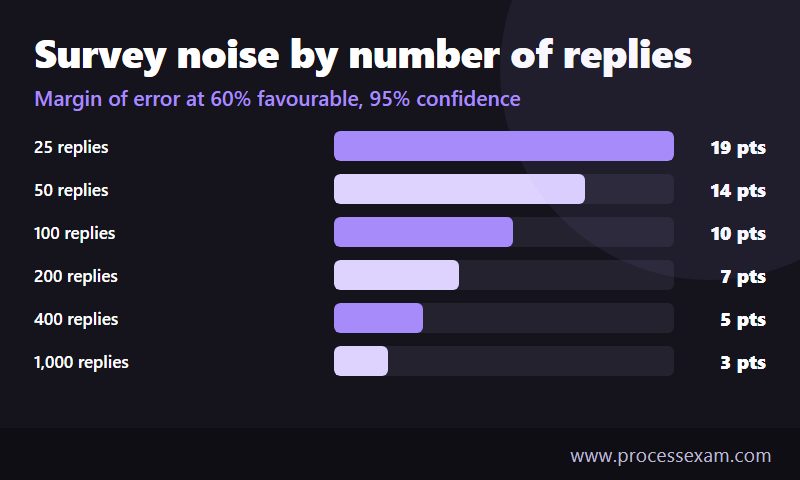
At 60% favourable, 25 replies leave a margin of about 19 percentage points either way; 100 replies, about 10; 400 replies, about 5. So a team that moves from 60% to 68% on 50 replies has shown nothing the margin cannot explain, while a company-wide move of the same size on 2,000 replies probably means something. The same arithmetic warns against comparing teams by a few points and ranking them in a league table.
The better test for a process change is the record that the change was meant to move. A control chart of the weekly on-time rota rate, for instance, shows whether performance has shifted beyond its usual variation. Use the survey as confirmation, not as the only evidence.
What does a Six Sigma pass over one satisfaction driver look like?
The walk-through below uses one driver from the Pareto above, rota notice, in a fictional distribution centre with three shifts. Every number is invented for illustration and must not be read as a benchmark or a typical result.
| Stage | What the team does | Illustrative result |
|---|---|---|
| Define | Write the CTQ and the scope. Fix the operational definition: a rota counts as on time if it is published at least 7 days before the first shift | Goal: on-time rotas above 90% for all shifts. The sponsor is the operations manager |
| Measure | Check the rota system's publish dates for 12 weeks. Ask the single pulse item "I get my rota with enough notice" to establish a baseline | 42% of rotas on time; 48% of 40 replies favourable |
| Analyse | Stratify by shift. Trace late rotas back through the steps. Test whether agency cover confirmation is the delay | Night shift 22% on time, day shift 61%; night rotas wait for agency confirmation until the day before |
| Improve | Pilot a rule: rotas are frozen on Wednesday for the week after next, and agency cover is requested a week earlier | Eight-week pilot on the night shift |
| Control | Chart weekly on-time rate; repeat the pulse item after eight weeks; name the process owner and write the new step into the scheduling procedure | On-time rate 86%; favourability 61% of 38 replies |
Look at how the example uses the earlier sections. The CTQ came from the tree, the baseline from records plus a single fixed question, the root cause from stratifying by shift, and the proof from a record that did not depend on opinion. The pulse item rose from 48% to 61%, but with fewer than 40 replies the margin is about 15 points either way, so the survey result alone would not justify a conclusion. The on-time rate going from 42% to 86% does, and the survey agrees with it.
What to check afterwards
A fix that depends on one person's attention fades when that person moves. The control step should name who owns the rota rule, which chart shows it slipping, and what the response is when it does. Ask the pulse item again at three and six months, and watch absence on the night shift as a secondary signal. If the on-time rate holds and absence does not move, say so; not every satisfaction driver shows up in every metric, and reporting that honestly keeps the programme credible.
Where do survey and measurement skills earn credit on the ASQ Yellow Belt?
The tools in this guide are the ones a Yellow Belt is expected to use, and ASQ's Certified Six Sigma Yellow Belt Body of Knowledge, as set out on the CSSYB syllabus page, names most of them. The article is not an exam guide; the table shows where each idea sits so that the work you do at your desk doubles as revision.
| Idea in this article | Matching topic in the CSSYB Body of Knowledge |
|---|---|
| Turning a wish into CTQs | Voice of the customer: translating needs into quantifiable CTQ characteristics |
| Operational definitions, sources and frequency | Data collection plans |
| Surveys, interviews, check sheets | Data collection techniques |
| Bias, repeatability and reproducibility of the survey instrument | Measurement system analysis |
| Pareto chart of comment themes | Basic quality tools used throughout DMAIC |
| Weekly chart of the on-time rota rate | Control charts in the Control phase |
The exam facts for the certification are below.
| Exam detail | CSSYB |
|---|---|
| Full name | ASQ Certified Six Sigma Yellow Belt |
| Exam code | CSSYB |
| Vendor | ASQ |
| Number of questions | 90 |
| Exam duration | 138 minutes |
| Passing score | 550/750 |
| Fee | ASQ members $334; non-members $434; retakes $234 |
ASQ's own Six Sigma Yellow Belt page adds that the computer-delivered exam has 80 scored and 10 unscored questions, is open book, and has no experience or education requirement. Dates, fees and delivery options change, so confirm them there before you book. Once the measurement vocabulary feels familiar, the CSSYB practice exam is a useful way to see whether the definitions hold up when a question words them differently from the way you learnt them.
A short checklist before your next survey
- Is each CTQ written with an operational definition and a named data source?
- Does every question carry one idea and the same wording as last time?
- Are reply counts and response rates shown beside every score?
- Is there at least one record-based measure beside the survey measure?
- Have you stratified before ranking, and coded comments by two people?
- Does each action have a process owner and a chart that will show it slipping?
Frequently Asked Questions
How do you measure employee satisfaction with Six Sigma?
Define satisfaction as critical-to-quality characteristics with operational definitions, then collect both survey answers and records such as turnover, absence and on-time rota. Check the survey for bias and low response, split results by team and shift, and use a Pareto chart to find the biggest cause.
What is a good eNPS score?
There is no single good figure, because the result depends on the industry, country and sample size. eNPS is the percentage of promoters (9 or 10) minus detractors (0 to 6) on a 0 to 10 question. Track your own trend with a fixed question, and compare groups only when reply counts are large.
How many survey responses do you need?
It depends on the precision you want. At 60% favourable, 100 replies leave a margin of about 10 percentage points and 400 replies about 5, at 95% confidence. A team of six cannot support a reliable score, so set a minimum group size and report counts beside every result.
Which Six Sigma tool shows the biggest cause of dissatisfaction?
A Pareto chart of coded survey comments or exit-interview reasons shows which themes account for most complaints. Stratify the scores by team, shift and length of service first, so the chart is drawn for the group where the gap sits. Have two people code the comments to keep the counts fair.
Do you need to know satisfaction measurement for the ASQ Yellow Belt exam?
The exam tests the underlying tools, not employee surveys: CTQs, data collection plans, measurement system analysis, Pareto charts and control charts. The CSSYB exam has 90 questions in 138 minutes and a passing score of 550/750, and ASQ's Body of Knowledge lists the tested topics.
- Six Sigma |
- ASQ Six Sigma Yellow Belt Sample Questions |
- ASQ Six Sigma Yellow Belt Test Questions |
- CSSYB Question Bank |
- CSSYB Exam Questions Download |
- CSSYB Test Questions |
- Six Sigma Yellow Belt PDF |
- ASQ Six Sigma Yellow Belt Book |
- ASQ CSSYB BOK PDF |
- Six Sigma Yellow Belt Certification Cost |
- Six Sigma Yellow Belt Certification Requirements |
- CSSYB Body of Knowledge (BOK) |
- CSSYB Handbook


