
CQIA Quality Tools Explained With Worked Examples
Which quality tools does the CQIA test, and do you need an engineering background to use them? You do not. ASQ's Body of Knowledge names seven basic tools, five improvement techniques, two root-cause tools and two risk tools, and every one works with a pen and a page of tallies. This guide runs each through one small clinic front desk, using invented numbers, then shows how the exam words its questions.
Which tools does the CQIA Body of Knowledge list?
The tools are not gathered in one tidy section. They are spread across the Improvement domain, which ASQ weights at 40 of the 100 scored questions, and that spread is why candidates miss some. Reading ASQ's published outline (the CQIA Body of Knowledge, item B1158, marked 2020, checked November 2026) section by section gives this map.
- Improvement Techniques (tested at Apply level): brainstorming, the plan-do-check-act (PDCA) cycle, affinity diagrams, cost of poor quality (COPQ) and internal audits.
- Improvement Tools (Apply): seven basic tools, namely decision trees, control charts, check sheets, scatter diagrams, Pareto charts, histograms and flowcharts.
- Root Cause Analysis (Apply): the 5 Whys and the fishbone diagram, used to put a correction and a corrective action in place.
- Risk Management (Understand): failure modes and effects analysis (FMEA) and SWOT, plus prioritising work by risk.
- Process Improvement (Understand): the Six Sigma phases and a list of lean tools, including 5S, kanban, kaizen, value stream mapping and error-proofing.
The level in brackets matters more than the list itself. ASQ defines Apply as knowing when and how to use a method, while Understand means reading and interpreting a description, report or diagram. For the first three groups you must choose a tool for a situation and use it; for risk and lean you must follow what the tool says. The same ASQ document also lists a quality-basics topic on common and special cause variation, which the control chart builds on.
The examples below all come from one imaginary neighbourhood clinic whose first appointment of the day too often starts late. The figures are made up for teaching and are not ASQ data. They are small on purpose, so you can check every sum by hand.
How do the seven basic tools look at a clinic front desk?
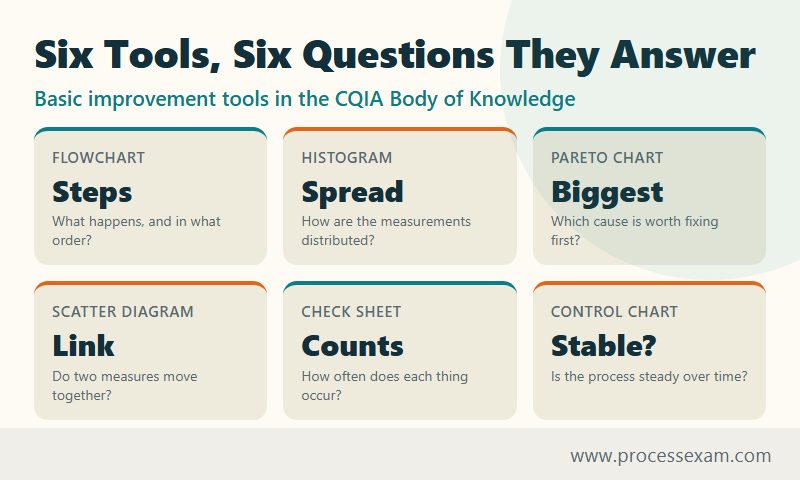
Treat the seven as a sequence a team could really follow: draw the process, count what goes wrong, rank the counts, look at the measurements, test a suspicion, watch the process over time, and weigh the fix. Each subsection ends with the point the exam tends to hinge on.
Flowchart: what actually happens at check-in?
The clinic manager asks the receptionist to sketch the first stretch of the day. She draws an oval for the start, a rectangle for each step (greet patient, confirm details, hand over a form) and a diamond wherever the path can split. One diamond reads "record found?". The yes arrow goes straight on to the waiting room. The no arrow loops through "search the paper store" and "ask the previous clinician" before it rejoins the main line.
That loop was never written in any procedure, yet it is part of how work really flows. Two tips for the exam: the diamond is always a decision with at least two exits, and a flowchart documents the process as it runs, which is why it usually comes first in a project.
Check sheet: how often does each problem occur?
Before anyone argues about causes, the team tallies every late start for four weeks, with one column per reason and a stroke for each event. A good check sheet is designed before collection and records the reason, not an opinion.
| Reason for a late start | Tally over four weeks |
|---|---|
| Patient record not found | 14 |
| Patient arrived late | 9 |
| Clinician started late | 6 |
| Forms incomplete | 5 |
| Room not ready | 3 |
| Other | 3 |
| Total late starts | 40 |
A check sheet gathers data; it does not analyse it. If an exam option says it "shows which cause is largest", it is describing the next tool.
Pareto chart: which cause deserves attention first?
Sort the tallies from largest to smallest and add a running percentage. Records not found account for 14 of 40, or 35 percent; adding late patients brings the running total to 23 of 40, or 57.5 percent; clinician delays take it to 72.5 percent, incomplete forms to 85 percent. Two causes out of six explain just under 60 percent of the problem, so the team starts with the records, not the room.
The chart ranks categories. It never shows how long anything took, and its bars are ordered by size rather than by time or process step.
Histogram: how are the waits spread out?
Now the receptionist measures, rather than counts. She records the wait for 40 patients and groups them into bands of five.
| Wait band (min) | 0-5 | 5-10 | 10-15 | 15-20 | 20-25 | 25-30 | 30-35 |
|---|---|---|---|---|---|---|---|
| Patients | 3 | 8 | 12 | 9 | 5 | 2 | 1 |
Drawn as touching bars, the shape peaks at the 10-15 band and trails off to the right. A single peak with a long right tail is common for waiting times. Two separate peaks would suggest two different groups mixed together, such as booked patients and walk-ins, and would be a reason to split the data. The bars touch because the horizontal axis is a continuous measurement; a Pareto chart's bars are separate categories.
Scatter diagram: do two measures move together?
The manager suspects that busy mornings cause long waits. For each morning she plots the number of walk-ins on the horizontal axis and the average wait on the vertical axis. If the dots climb from lower left to upper right, the relationship is positive; if they form a shapeless cloud, there is no relationship worth acting on; if they fall, it is negative.
The exam hazard is the word "cause". A scatter diagram shows that two things move together, and it cannot by itself prove that one drives the other. A third factor, such as a clinician being on leave, may be pushing both.
Control chart: is the process steady from day to day?
The team plots each day's average wait in order, with a centre line at the long-run average and an upper and lower control limit calculated from the data. Suppose the centre line is 14, the limits sit at 8 and 20, and one day plots at 23. That point lies outside the limit, so something unusual happened that day, perhaps the booking system was down. Points that wander inside the limits with no pattern are ordinary variation built into the process, and reacting to each one only adds noise.
Several points in a row on the same side of the centre line are also a warning, because it signals a shift even though no single point crossed a limit. The question a manager faces is not "was today bad?" but "is this a special cause I can find, or the process behaving as designed?"
Decision tree: which fix is worth choosing?
The records problem has two candidate fixes, and the clinic sets each out with its cost, its chances and its yearly saving, all in the same money units.
| Option | Cost | If it works as planned | If it only half works | Expected saving | Net |
|---|---|---|---|---|---|
| A: scan the old paper store | 4,000 | 70% chance, saves 10,000 | 30% chance, saves 2,000 | 7,600 | 3,600 |
| B: pull tomorrow's files the evening before | 1,000 | 50% chance, saves 5,000 | 50% chance, saves 1,000 | 3,000 | 2,000 |
For A the expected saving is 0.7 x 10,000 + 0.3 x 2,000 = 7,600, so the net is 3,600. For B it is 0.5 x 5,000 + 0.5 x 1,000 = 3,000, so the net is 2,000. A wins on expected value, though B is cheaper and safer to try first. Because the Body of Knowledge sets decision trees at Apply level, expect to roll the numbers back along the branches yourself, not just to recognise the diagram.
What do the five improvement techniques look like in practice?
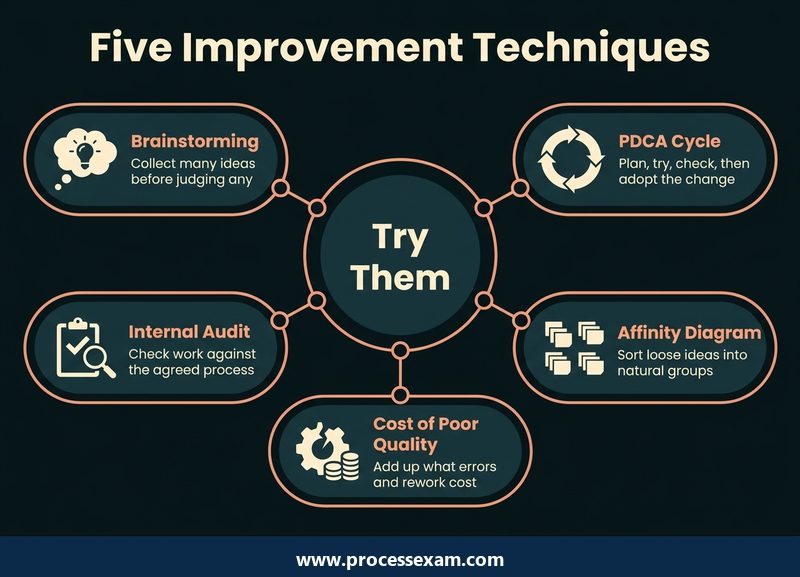
These sit in a different part of the outline from the charts, and they describe how a team works, not how it draws. They are also tested at Apply level, so each can appear as a "which should the team do next?" scenario.
Brainstorming
Asked how to stop records going missing, the clinic's six staff write down ideas for a few minutes without discussing them. The rules are the point: many ideas before any judgement, no criticism, and building on other people's suggestions. Evaluation comes later, and a team that debates each idea as it appears usually ends with fewer.
Affinity diagram
The brainstorm produced 24 sticky notes. The team sorts them in silence into groups that seem to belong together and only then names each group: "before the visit", "at the desk", "storage", "people". The tool's job is to make sense of a large, untidy set of ideas, so the exam answer is usually an affinity diagram when a question says "many ideas" and "natural groupings".
PDCA cycle
The team picks one idea and tests it small. Plan: pull next-day files each evening for one clinician and expect the not-found tally to fall. Do: run it for two weeks. Check: compare the new tallies with the old. Act: adopt it clinic-wide if it worked, or adjust and go round again. The cycle repeats, and the Check step is the one teams skip, which turns a trial into an assumption.
Cost of poor quality
The manager prices the failure. Fourteen record searches in four weeks, at about an hour of combined staff time each, is 14 hours; at 20 per hour that is 280. It is a floor rather than a total, because it leaves out the patient's wait and the clinician's idle time, but a figure in money gets a budget conversation going when a count of "late starts" does not.
Internal audit
A colleague from another team checks ten recent check-ins against the written procedure and finds that two skipped the identity check. An internal audit compares what people do with what the system says they should do; it looks at the process rather than at individuals, and it is carried out by the organisation itself, not by a customer or a certification body.
How are root cause and risk tools different from the charts?
Charts show where and how much. Root cause tools ask why, and risk tools ask what could go wrong next. The first pair is tested at Apply level, the second at Understand.
5 Whys and the fishbone diagram
Keep asking why until a process fault, not a person, is at the end of the chain. The patient waited because the clinician started late; the clinician started late because the record was not at the desk; the record was not at the desk because it was filed under an old surname; it was filed there because the index uses surnames only; the index uses surnames only because no one owns updating it when a name changes. The last link is something the clinic can fix.
A fishbone diagram suits a problem with several possible sources. Draw the problem at the head, add bones for categories such as people, method, materials, equipment, measurement and environment, and place each suspected cause on its bone. It lists candidates for testing; it does not tell you which one is true.
The Body of Knowledge asks for "correction and corrective action", and the two differ. Correction deals with the instance in front of you: find this patient's file. Corrective action removes the cause so it does not recur: give every patient an ID number and give someone the job of keeping the index current.
FMEA and SWOT
FMEA lists the ways a step could fail and scores each on severity, occurrence and detection, usually from 1 to 10, where a high detection score means the failure is hard to spot. Multiplying the three gives a risk priority number.
| Failure mode | Severity | Occurrence | Detection | Priority number |
|---|---|---|---|---|
| Allergy field left blank | 10 | 2 | 7 | 140 |
| Wrong patient's record opened | 9 | 3 | 4 | 108 |
| Record not found | 4 | 8 | 2 | 64 |
The rare, quiet, dangerous failure ranks above the frequent, obvious, harmless one. That is the lesson behind ASQ's wording on prioritising activities and projects based on risk: frequency alone does not set the order. SWOT works at a different scale. It sets the clinic's internal strengths and weaknesses beside external opportunities and threats, so it frames priorities for an organisation, while FMEA works step by step through a single process.
What do the lean tools in the list expect you to know?
The Body of Knowledge names these at Understand level, so the task is to recognise each idea and say what problem it addresses, not to run it. Using the clinic again:
- 5S (sort, set in order, shine, standardise, sustain) tidies the supplies cupboard so each item has a labelled place and anything missing is visible at once.
- Kanban is a pull signal: when a box of gloves reaches a marked line, a card goes to the ordering clerk, so stock is replaced by use and not by guesswork.
- Just-in-time aims to have materials arrive when needed rather than in large, early batches.
- Kaizen means continuous improvement in small steps by the people doing the work.
- Value stream mapping draws the whole journey of a patient or an order and marks each step as adding value or not, which exposes waiting and rework.
- Set-up and cycle-time reduction speeds the changeover between jobs, such as turning an examination room around between patients.
- Error-proofing (poka-yoke) designs a step so the mistake cannot happen, such as a form that will not submit with the allergy field empty.
Mixed questions often pair a lean tool with the waste it attacks. If a stem describes waiting or overstocking, think of pull systems; if it describes a mistake slipping through, think of error-proofing.
How does the exam word a tool question, and how should you answer?
ASQ's own page describes a one-part, multiple-choice exam, computer-delivered or on paper, built to measure comprehension of the Body of Knowledge. It does not publish how many questions fall on each tool, so the best preparation is to meet each tool in more than one disguise. Here are the main ones, with original practice-style scenarios written for this article.
- Situation to tool. "A team has 30 ideas from a workshop and needs to organise them into themes." The answer is an affinity diagram. A fishbone would also group things, but it groups causes of one problem, not loose ideas.
- Chart to reading. "A control chart shows one point above the upper limit and the rest scattered about the centre line." That is a likely special cause, so look for what changed that day.
- Result to next step. "A Pareto chart shows two causes account for most complaints." Start with those two, then repeat the check.
- Near pairs. Check sheet and histogram both involve counting; the check sheet collects the counts, and the histogram shows how measured values are distributed. Correction and corrective action both involve fixing; only one stops the repeat.
Read the verb in the stem: "collect" points to a check sheet, "rank" to a Pareto chart, "group" to an affinity diagram, "map the steps" to a flowchart, "separate ordinary from unusual variation" to a control chart. The Body of Knowledge gives you the wording to calibrate against; the clinic examples here are for understanding the tools, not predicting the paper.
Here are the exam details in one place, as ASQ lists them for the computer-based sitting.
| Exam detail | CQIA |
|---|---|
| Certification | ASQ Certified Quality Improvement Associate (CQIA) |
| Questions | 110 (100 scored, 10 unscored) |
| Exam time | 198 minutes (total appointment 210 minutes) |
| Passing score | 550 out of 750 |
| Fees | ASQ members $334, non-members $434, retakes $234 |
| Eligibility | Two years of work experience, or an associate degree, or two years of equivalent higher education |
The ASQ certification page also describes the exam as open book, with candidates bringing their own references, so read the conditions there before you pack; the page is at ASQ's CQIA certification page. To see how scenarios like these are phrased, work through the CQIA sample questions and note which verb in each stem decides the answer.
How can you practise these tools without a project or special software?
You only need a notebook and numbers you already have. Try each of these on your own work; the aim is to feel the difference between the tools, which is what the near-pair questions test.
- Tally something for a week. Email interruptions, reasons for rework or missed handovers will do. Then rank the tally as a Pareto chart.
- Time something repeatedly. Record 30 values of any task, group them into bands and draw the histogram. Look at the shape before the average.
- Plot a daily number in order. Mark a centre line by eye and ask which points would deserve an explanation.
- Draw one routine as a flowchart. Add every loop and workaround people actually use, not the ones in the manual.
- Take one recurring problem down five whys, and stop at a cause that a process change could remove.
- Score three risks with FMEA. Compare your ranking by priority number with your gut ranking.
When the tools feel automatic, check yourself on scenario wording. The CQIA practice exam gives you stems to decode against the verbs listed above, and your wrong answers will show which near pair you still mix up.
The tools reward this repetition because they are small ideas with sharp edges. Once you can say, for each, what question it answers and what it cannot tell you, the Improvement domain stops being a list to memorise and becomes a set of choices you can make.
Frequently Asked Questions
Which quality tools are on the CQIA exam?
ASQ lists seven basic tools: flowcharts, histograms, Pareto charts, scatter diagrams, check sheets, control charts and decision trees. Alongside them are brainstorming, PDCA, affinity diagrams, cost of poor quality, internal audits, the 5 Whys, fishbone diagrams, FMEA and SWOT, plus lean tools such as 5S and kanban.
Do I have to draw or calculate with the tools on the CQIA?
ASQ sets the basic tools, techniques and root cause tools at Apply level, meaning you select, interpret and use them. It does not publish a formula list. A basic scientific calculator is on screen for the computer-based exam, so practise reading charts and doing short sums by hand.
What is the difference between correction and corrective action?
A correction fixes the instance in front of you, such as finding one missing record. A corrective action removes the cause so the problem does not recur, such as changing how records are indexed. The Body of Knowledge asks candidates to use root cause tools to put both in place.
Is the CQIA exam open book?
ASQ describes the CQIA as an open-book exam: candidates bring their own reference material, and ASQ sets conditions on what is allowed. Read those conditions on ASQ's certification page before exam day. An open book helps with definitions but not with choosing the right tool under time pressure.
Are the lean tools tested as deeply as the basic tools?
No. ASQ tests the basic tools, improvement techniques and root cause tools at Apply level, while lean, Six Sigma and risk tools such as FMEA and SWOT sit at Understand level. For those you need to recognise the idea and say what problem it addresses, rather than carry it out.
- ASQ Quality Improvement Associate Test Questions |
- CQIA Question Bank |
- CQIA Body of Knowledge (BOK) |
- ASQ Quality Improvement Associate Sample Questions |
- CQIA Exam Questions Download |
- CQIA Test Questions |
- Quality Improvement Associate PDF |
- ASQ Quality Improvement Associate Book |
- ASQ CQIA BOK PDF |
- Quality Improvement Associate Certification Cost |
- Quality Improvement Associate Certification Requirements |
- Foundation Quality |
- CQIA Handbook


