
Six Sigma Benefits for an Organisation and How Each Is Measured
A finance director asks a fair question before approving a Six Sigma programme: which line of the accounts will move, by how much, and how will anyone know it was the programme that moved it? Most articles on the benefits of Six Sigma answer with adjectives such as efficiency, loyalty and morale. This one answers with measures. An organisation gains fewer defects, lower cost of poor quality, shorter and more predictable cycle times and fewer complaints, and each of those has a number that can be read before and after. It also pays to know when the sums do not work.

The method itself needs one sentence here. Six Sigma is a project-by-project way of finding the cause of a defect with data and removing it, usually following the define, measure, analyse, improve, control sequence known as DMAIC. Everything below is about what that buys a business, and how to prove it.
Which Six Sigma benefits can a finance director actually check?
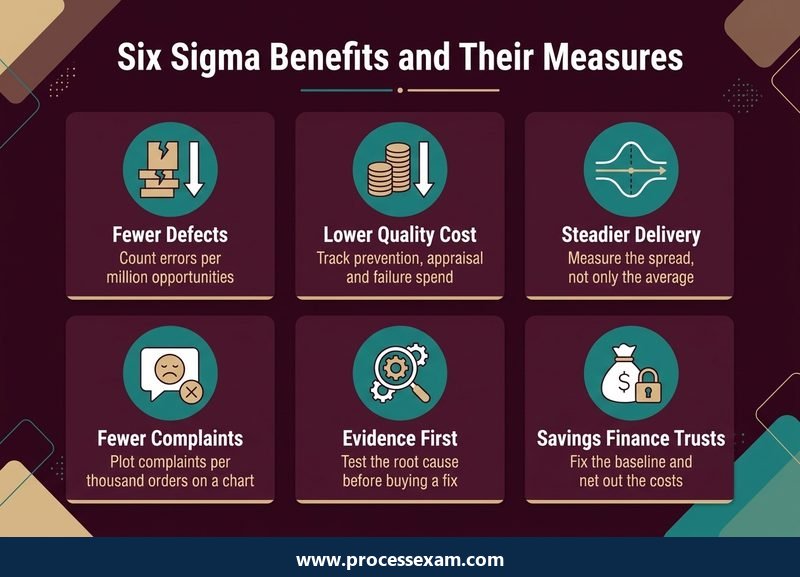
Five benefits survive scrutiny because each one maps to a figure the business already records or can start recording. The table pairs each with the measure that proves it and the place where the effect should show up.
| Benefit | How it is measured | Where it shows up |
|---|---|---|
| Fewer defects | Defects per million opportunities (DPMO) and the sigma level it implies | Scrap, rework and returns |
| Lower cost of poor quality | Annual spend on prevention, appraisal, internal failure and external failure | Operating cost, warranty and credit notes |
| Faster, steadier delivery | Mean cycle time and its spread, plus the share delivered inside the promise | Working capital, on-time delivery |
| Fewer complaints | Complaints per thousand orders, tracked on a control chart | Retention, refunds, support workload |
| Decisions made on evidence | Share of projects whose root cause was tested with data before a fix was bought | Capital and project spend avoided |
Notice what is missing. Staff happiness, a better culture and a stronger brand may all follow, but they are by-products with no clean before-and-after number, and a sceptical reader is right to discount them. A programme that cannot name a measure for its benefit is describing hope, not a result.
How does a sigma level turn into a defect count and a cost?
The unit of defect measurement is the opportunity, meaning any point in a product or transaction where something could go wrong. The formula is simple: DPMO equals defects divided by the number of units multiplied by the opportunities per unit, all multiplied by 1,000,000.
A worked example you can reproduce
Take a hypothetical order-entry process that handles 5,000 orders in a month, with four places on each order where an error could occur: the customer record, the price, the delivery address and the product code. That is 5,000 x 4 = 20,000 opportunities. Suppose a sample audit finds 130 errors. Then 130 / 20,000 = 0.0065, which is 6,500 DPMO.
The conversion to a sigma level uses the convention that Six Sigma reporting adds a 1.5 sigma shift to allow for drift over the long term. On that convention the standard reference values, as listed on Wikipedia's Six Sigma page, are these.
| Sigma level | Defects per million opportunities | Yield |
|---|---|---|
| 2 | 308,538 | 69% |
| 3 | 66,807 | 93.3% |
| 4 | 6,210 | 99.38% |
| 5 | 233 | 99.977% |
| 6 | 3.4 | 99.99966% |
Our 6,500 DPMO sits just above the 4 sigma figure of 6,210, so the process runs at a little under 4 sigma, about 3.98. Now price the defects. If correcting one error costs $30 in staff time and goodwill, the month's 130 errors cost $3,900. A project that lifts the process to 5 sigma, 233 DPMO, leaves 20,000 x 233 / 1,000,000 = about 4.7 errors, or roughly $140. The monthly saving is about $3,760, or a little over $45,000 across twelve months, from one narrow process. The numbers are invented to show the arithmetic; the method is what carries over.
Two cautions about the sigma number
First, the 3.4 figure is not a promise that everything a business does will be defective only 3.4 times in a million. It is a long-term rate for each opportunity, and it assumes the 1.5 sigma shift. Quote a sigma level without stating how the opportunities were defined and the number cannot be compared with anyone else's. Second, defining more opportunities per unit lowers DPMO without making anything better, because the denominator grows. A finance director should ask for the opportunity definition before accepting any sigma claim.
What does cost of poor quality look like before and after a project?
Cost of poor quality, in the quality profession's vocabulary the cost of quality, splits spend into four buckets. Prevention is money spent so that defects do not occur: training, design review, process control. Appraisal is money spent finding them: inspection and testing. Internal failure is the cost of defects caught before the customer sees them: scrap and rework. External failure is the cost of defects the customer finds: returns, warranty, credits and lost trade.
The ASQ Body of Knowledge for the Certified Manager of Quality/Organizational Excellence asks managers to evaluate the effect that a change in one category has on the others. That is the practical point. Spending more on prevention is a cost that pays back by shrinking the failure buckets, and a business that cuts prevention to protect this quarter's budget usually pays for it twice in failures.
An illustrative before and after
The figures below are invented to show the shape of a typical result, not taken from any company. Imagine a mid-sized operation tracking annual cost of poor quality across a year before a programme and a year after its projects closed.
| Category | Before ($ thousand) | After ($ thousand) | Change |
|---|---|---|---|
| Prevention | 40 | 70 | +30 |
| Appraisal | 120 | 90 | -30 |
| Internal failure | 260 | 130 | -130 |
| External failure | 180 | 60 | -120 |
| Total | 600 | 350 | -250 |
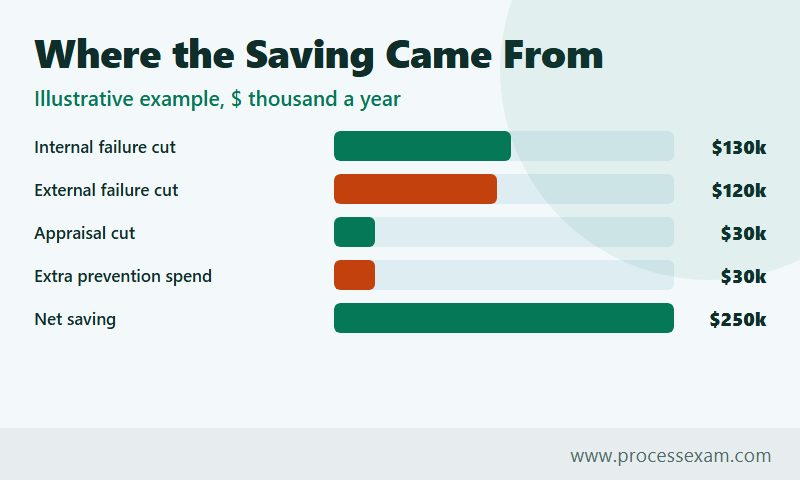
Prevention rose by 30 and the total fell by 250, a reduction of about 42 percent. Two lessons sit in that table. The saving came overwhelmingly from the failure buckets, which is where defect-reduction projects aim. And appraisal fell only because the process became capable enough that less inspection was needed; cutting inspection before the process improves just moves failures to the customer.
Start measuring this before the programme starts. Without a baseline year, any later claim of savings rests on memory, and finance will, rightly, decline to book it.
Can you prove shorter cycle times, or only a better average?
Cycle time is the benefit most often reported by its average and most often misunderstood. Six Sigma's contribution is not mainly to move the average. It is to shrink the spread around it, and the spread is what makes a customer promise reliable.
Suppose orders take on average 5 days to deliver, with a standard deviation of 2 days, roughly normally distributed, and the business promises delivery within 8 days. The promise sits 3 days from the average, which is 1.5 standard deviations. On a normal curve, about 6.7 percent of orders then arrive late and 93.3 percent on time. Now a project that fixes causes of delay leaves the average at 5 days but halves the standard deviation to 1 day. The promise now sits 3 standard deviations from the average, and only about 0.13 percent of orders are late. The average never moved; the late deliveries fell by roughly 98 percent.
This is why a cycle-time claim should be reported as three numbers: the average, the spread, and the percentage delivered inside the promise. A programme that reports only a faster average may have made delivery less predictable, and customers feel the late order more than the quick one.
Where the time goes is the project, not the metric
Measuring is the easy half. The work in a cycle-time project is separating time spent adding value from time spent waiting in queues, handoffs, approvals and rework loops. Teams that map the process commonly find the waiting dwarfs the working. The benefit is credited only when a before-and-after measurement on the same definition of start and stop is available.
How do you tell fewer complaints from a lucky month?
Complaint counts bounce from month to month with no change in the process at all, so a single lower number proves nothing. Six Sigma's answer is the control chart, which sets limits within which ordinary variation is expected and flags only a movement beyond them.
A worked check shows how it behaves. If a business averages 18 complaints a month, the count behaves roughly like a Poisson process whose standard deviation is the square root of 18, about 4.2. Three-sigma limits are then 18 plus or minus about 12.7, a range of roughly 5 to 31 complaints. A month with 12 complaints looks like a win, but it sits inside the limits, so it is not evidence of improvement. Eight consecutive months below the centre line, or a point below the lower limit, would be.
Always report complaints as a rate, not a raw count. Complaints per thousand orders survives a change in volume, where a raw count may fall simply because trade did. Customers who leave rarely say why, so measure repeat purchase and retention alongside complaints; a quiet customer who departs never appears in the complaints log.
When does Six Sigma fail to pay for itself?
The method is not free, and several conditions make the sums come out negative. A balanced account has to list them.
- Too little volume to measure. DPMO and control charts need data. A process run twenty times a year offers too few observations to separate signal from noise, and a lighter approach is cheaper.
- Savings that never reach the ledger. A project can shorten a task by ten minutes, but unless the freed time is used or the cost removed, nothing changes in the accounts. Finance people distinguish hard savings, which cut a budget line, from soft savings, which free capacity. Counting both as cash inflates the programme.
- Problems that are not statistical. If the cause is an obvious missing step or a broken tool, a quick fix is faster than a four-month DMAIC project.
- Training and project cost. Belts spend time off their day jobs, and the cost of the programme belongs on the other side of the balance sheet from the benefits.
- Innovation. Wikipedia records the criticism, made by the editor of Design News among others, that a tightly controlled method can stifle open-ended creative work. It suits incremental improvement of an existing process better than a blank page.
What the published claims do and do not show
Wikipedia reports that Motorola attributed more than $17 billion in savings to Six Sigma by 2005, and that GE announced $350 million in savings in 1998. Both are company statements, not audited studies, so treat them as the claims of organisations with an interest in the programme. The same page notes a 2006 Fortune report that 91 percent of 58 large companies announcing Six Sigma programmes had trailed the S&P 500 since. That analysis was made by a consultancy promoting a competing approach, and a share-price comparison cannot isolate one programme's effect. Put together, the honest reading is that the evidence neither proves that Six Sigma pays everywhere nor shows that it fails; results depend on project selection and follow-through.
How should savings be counted so the numbers survive an audit?
Credibility is a process, not a calculation. Organisations whose Six Sigma savings are believed usually settle a handful of rules before the first project.
- Fix the baseline. Record the measure, the period and the data source before the project starts, and keep it unchanged.
- Agree the definition with finance. Decide in advance which savings are hard, which are soft and which are cost avoidance, and report them in separate columns.
- Track after closure. A saving that appears for a quarter and fades was a one-time event. Follow the measure for a year on a control chart.
- Net out the costs. Subtract project, training and any added prevention spend from the gross figure.
- Let the process owner sign. The person who runs the process, not the project leader, confirms the new level holds.
The earlier table shows why the fourth rule matters. Its 250 thousand saving is a net figure, because the extra 30 thousand of prevention spend is already counted against it. Quote only the 280 thousand gross fall in failure and appraisal costs and the claim overstates what the business kept.
The hardest benefit to price: fewer wrong guesses
The fifth benefit in the first table, decisions made on evidence, rarely appears as a saving at all, because its value is the spending that did not happen. A team that suspects a machine is the cause of a defect may be ready to buy a replacement. A short capability study that shows the machine holds its tolerance, and that the variation comes from a material supplier, spares the purchase. Record that as cost avoided, label it separately from hard savings, and keep the evidence on file so a later reader can see the decision was tested rather than assumed.
Why suppliers belong in the measurement
A defect that originates upstream still lands on your cost-of-quality table. Incoming material that fails inspection adds appraisal and internal failure cost, and a defect that slips through becomes external failure. Measuring supplier defect rates in the same DPMO terms as your own process lets you compare like with like, and it turns a vague complaint about a vendor into a figure that can be written into a quality agreement. The improvement a business buys in this way is real, but it should be credited to the supply relationship rather than to the internal project that happened to be running at the time.
Where do these measures show up for a quality manager sitting the CMQ/OE?
The vendor's 2026 Body of Knowledge for the ASQ Certified Manager of Quality/Organizational Excellence places this material in domain IV, Quality Management Tools, which carries 31 of the exam's questions. Candidates are expected to select, interpret and evaluate process improvement tools including Six Sigma DMAIC and design for Six Sigma, and to evaluate how a change in one cost-of-quality category affects the others. Supplier evaluation in domain VI also names defect rates among the measures managers must weigh. You can read the full outline on ASQ's CMQ/OE Body of Knowledge and the overview on ASQ's Manager of Quality certification page. The syllabus structure is also laid out on the CMQ/OE syllabus page.
| Exam detail | CMQ/OE |
|---|---|
| Exam name | ASQ Certified Manager of Quality/Organizational Excellence |
| Exam code | CMQ/OE |
| Vendor | ASQ |
| Number of questions | 180 |
| Exam duration | Total appointment time - 270 minutes Exam time - 258 minutes |
| Passing score | 550/750 |
| Exam fee | ASQ MEMBERS - $485 NON-MEMBERS - $585 RETAKES - $385 |
The calculations in this article, DPMO, sigma levels, the cost-of-quality balance and control limits, are the kind a manager is expected to do and defend, so working them by hand is useful preparation. Candidates preparing for the paper can meet the same arithmetic in question form on the CMQ/OE practice exam.
What a manager takes from this to the next budget meeting
Ask for the baseline, the measure, the opportunity definition and the net saving, in that order. A proposal that supplies all four is a business case. One that supplies none is a slogan. The benefits of Six Sigma are real where defects are frequent, costly and countable, and a manager who can show the arithmetic is the one who gets the next project funded.
Frequently Asked Questions
What are the benefits of Six Sigma for an organisation?
Six Sigma lowers the defect rate, the cost of poor quality, cycle-time variation and the number of complaints. Each has a measure: DPMO, the four cost-of-quality categories, the spread of delivery times, and complaints per thousand orders. Culture and morale may improve too, but they have no clean number.
How does Six Sigma save money?
It finds and removes the causes of errors, rework, returns and delays. The saving appears mostly in internal and external failure costs, partly offset by extra prevention spending. Savings count only when finance confirms a budget line fell, measured against a baseline taken before the project began.
What does 3.4 defects per million mean?
It is the long-term defect rate for a 6 sigma process, calculated per opportunity for error, not per product, and it includes a 1.5 sigma allowance for drift. A 4 sigma process is 6,210 DPMO and a 5 sigma process 233. Counting more opportunities can flatter the figure.
When is Six Sigma not worth the cost?
It struggles where volume is too low to measure, where the cause is an obvious fix, where savings never reach a budget line, and where the work is open-ended creative effort. Training and project time are real costs that must be netted against the claimed gain.
How do you know complaints really fell?
Report complaints per thousand orders and plot them on a control chart. With an average of 18 a month, limits fall at roughly 5 and 31, so a month of 12 is normal variation. A run of months below the centre line or a point under the lower limit is real.
- ASQ Manager of Quality/Organizational Excellence Sample Questions |
- CMQ/OE Exam Questions Download |
- CMQ/OE Test Questions |
- Manager of Quality/Organizational Excellence PDF |
- ASQ Manager of Quality/Organizational Excellence Book |
- ASQ CMQ/OE BOK PDF |
- Manager of Quality/Organizational Excellence Certification Cost |
- Manager of Quality/Organizational Excellence Certification Requirements |
- ASQ Manager of Quality/Organizational Excellence Test Questions |
- CMQ/OE Body of Knowledge (BOK) |
- Management |
- CMQ/OE Question Bank |
- Manager of Quality/Organizational Excellence Simulator |
- Manager of Quality/Organizational Excellence Mock Exam |
- CMQ/OE Handbook


