Statistical Skill Is Required for Better Understanding of Six Sigma Process
Measurements of process inputs and outputs can be used to optimize the process being measured. Process inputs may be raw materials, human resources or services. All inputs have some quantifiable measurement, including human effort and skill level. Process input requirements should be stated so that key measures of input quality can be controlled. Measurements within the process can also be used as effective controls. Once process capabilities are known, output measures can be used to monitor if the process has remained in control. Feedback from downstream process measurements can be used to improve an upstream process.
For example, electrical testing for solder shorts can be used to optimize a circuit board soldering operation even if it is several processes upstream from the testing operation. When considering the entire organizational feedback system, complex interrelationships are likely to exist. This is where planned experimentation and designing for six sigma comes into play. Planned experimentation deals with isolating the effects of several different, independent variables on a process. Designing for six sigma includes eliminating potential sources of error.
Continuous Distribution: A distribution is containing infinite (variable) data points that may be displayed on a continuous measurement scale.
Examples: normal, uniform, exponential, and Weibull distributions.
Discrete Distribution: A distribution is resulting from countable (attribute) data that has a finite number of possible values.
Examples: binomial, Poisson, and hyper geometric distributions.
-
Parameter: The true numeric population value, often unknown, estimated by a statistic.
-
Population: All possible observations of similar items from which a sample is drawn.
-
Statistic: A numerical data value taken from a sample that may be used to make an inference about a population.
DESCRIPTIVE STATISTICS
Descriptive statistics include measures of central tendency, measures of dispersion, probability density function, frequency distributions, and cumulative distribution functions.
-
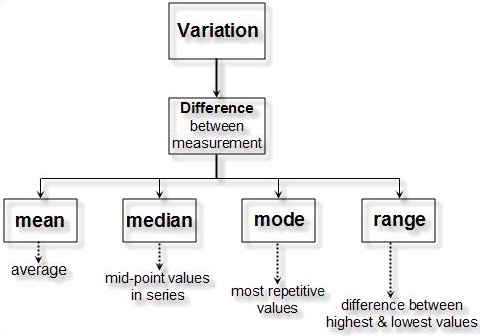
Measures of Central tendency: Measures of central tendency represent different ways of characterizing the central value of a collection of data. Three of these measures will be addressed here: mean, mode, and median.
-
Measures of Dispersion: The other important parameter to describe a set of data is spread or dispersion. Six Sigma Statistics Descriptive Statistics Measures of Central Tendency Measures of central tendency represent different ways of characterizing the central value of a collection of data.
Three of these measures will be addressed here:
-
Mean: Mean is the arithmetic average of all data-points in the data set
-
Median: Median is the middle most data point in the data set
-
Mode: Mode is the most frequently occurring data point in the data set
The mean is the total of all data values divided by the number of data points. The arithmetic mean is the most widely used measure of central tendency.
Point to remember: As the process six sigma value increases from zero to six, the variation of the process around the mean value decreases. With a high enough value of process sigma, the process approaches zero variation and is known as ‘zero defects.’
Decrease your process variation (remember variance is the square of your process standard deviation) to increase your process sigma. The result is greater customer satisfaction and lower costs.